This article presents the latest Shopify statistics for 2024, focusing on its growth and current achievements. It provides an insight into Shopify’s position within the eCommerce sector and anticipates its future trajectory.
The collected data details a view of Shopify’s influence and standing as of 2024, showcasing metrics and trends that define Shopify’s influence in the market, and amongst its competitors:
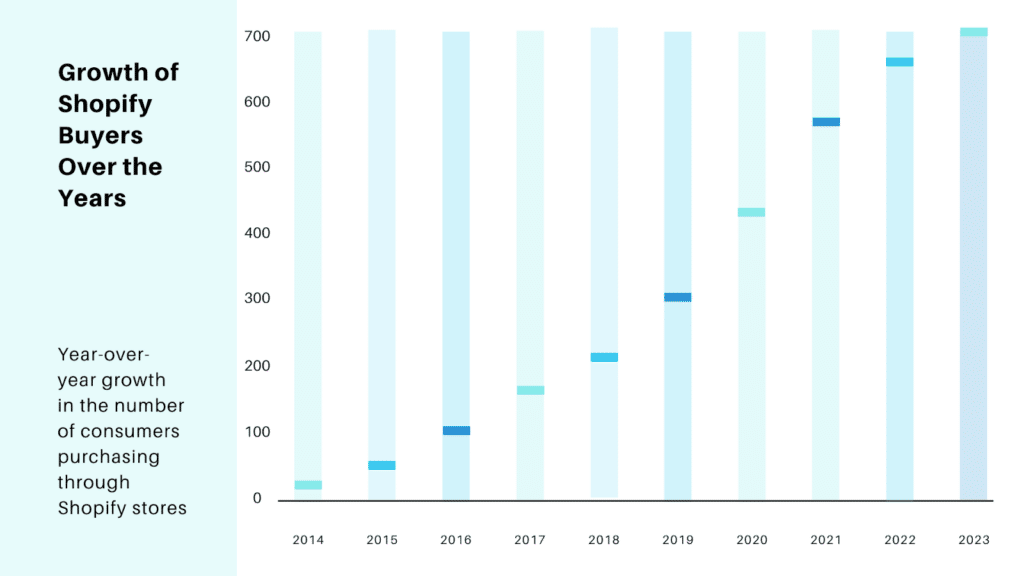
User Base and Market Share
Shopify’s global reach and the diversity of its users are proof of its appeal to a wide range of merchants, from small shops to large brands across various countries.
- Shopify’s user base expanded to 4,806,000 by 2024, up from 41,000 in 2012.
| Year | User Base |
| 2012 | 41,000 |
| 2017 | 609,000 |
| 2020 | 1,749,000 |
| 2022 | 3,882,345 |
| 2023 | 4,890,000 |
- Over 1.75 million merchants utilize Shopify across 175 countries, with an average revenue per shopper documented at $90.
- Merchant Concentration:
- United States
- UK
- Australia
- Brazil
- Germany
- Shopify currently has the largest eCommerce platform market share in the USA, with nearly one in three (28%) online businesses using it.
- Shopify commanded a 20% market share of eCommerce websites in 2020, with a 55% increase in store counts in Q4 2021.
- Shopify’s eCommerce platform market share stood at 16.36% in 2023, with the global eCommerce market share documented at 16.36% as of the year 2023, evidencing its significant stake in the online retail sector.
Financial Performance
- Financial data for Q2 2023 shows a 31% year-over-year increase in revenue, reaching $1.7 billion, with cumulative revenue hitting $4.9 billion in the first three quarters of 2023.
- The platform’s market cap as of the second quarter of 2023 was valued at $74.09 billion.
- Subscription Solutions revenue grew 21% year-on-year to $486 million in Q3 2023.
- Shopify reported an operating loss of $193 million in the first quarter of 2023 but maintained significant cash reserves of $4.9 billion by March 31, 2023.
| Year | Revenue ($ billion) | Market Cap ($ billion) | Subscription Solutions Revenue ($ million) | Merchant Solution’s Revenue ($ million) |
| 2022 | 5.6 | – | 1500 | 4100 |
| 2023 (Q1-Q3) | 4.9 | 74.09 | 1310 | 3600 |
- Merchant Solution’s revenue also saw a significant increase, growing 35% to $1.3 billion in Q2 2023.
- Year-over-year gross profit escalation of 27%, indicating fiscal growth and profitability metrics.
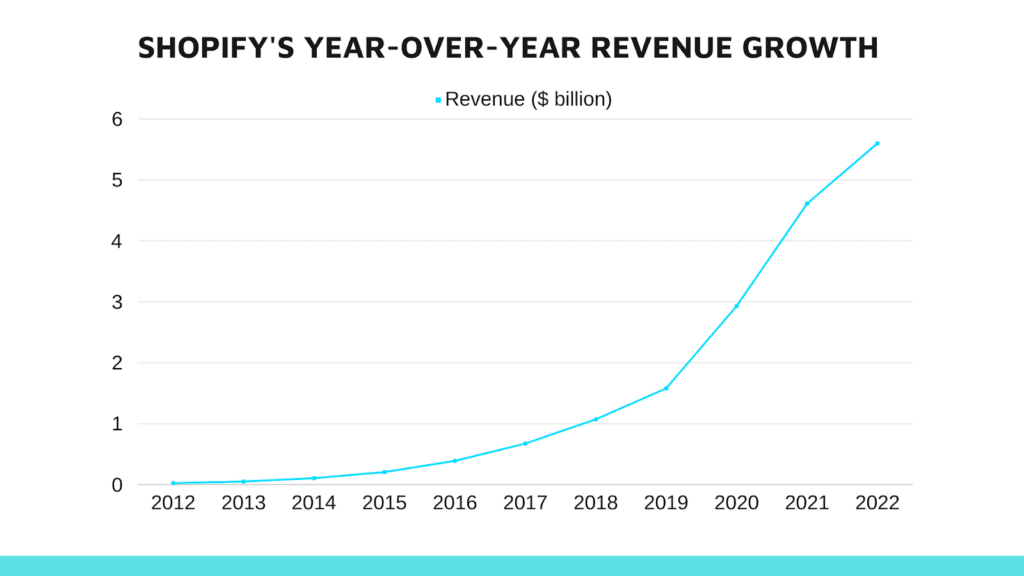
Shopify’s Gross Merchandise Volume
| Year | Gross Merchandise Volume (GMV) [$ billion] | Total Revenue [$ billion] |
| 2012 | 0.707 | 0.02371 |
| 2013 | 1.62 | 0.05025 |
| 2014 | 3.76 | 0.10502 |
| 2015 | 7.7 | 0.20523 |
| 2016 | 15.37 | 0.38933 |
| 2017 | 26.32 | 0.6733 |
| 2018 | 41.1 | 1.07 |
| 2019 | 61.14 | 1.58 |
| 2020 | 119.58 | 2.93 |
| 2021 | 175.4 | 4.61 |
| 2022 | 197.3 | 5.6 |
| 2023 (As of Q3) | 160.8 | 4.9 |
Commerce and Merchant Success
Shopify reports having 1.749 million merchants, with over 680 thousand added from the growth surge in 2020. This increase highlights Shopify’s significant role in enabling businesses to pivot or expand into eCommerce amidst the global shift toward online shopping.
The distribution of Shopify merchants by region includes the United States holding 65% of the share, followed by EMEA at 20%, Asia Pacific, Australia, and China at 8%, Canada at 6%, and Latin America at 4%.
- Over 6.95 million stores have been created on Shopify, evidencing a 200% increase post-2020, propelled by the pandemic-induced shift towards digital commerce, with the number of stores selling apparel leading at 531,409+, marking it as the best-selling niche.
| Category | Number of Stores | Economic Activity Generated ($ billion) | Cross-border Sales ($ billion) |
| Apparel (Leading Category) | 531,409+ | 300 (Annually) | 20 |
- Shopify merchants generate over $300 billion in economic activity annually and have created more than 3.6 million jobs. In fact, in 2020, Shopify merchants together generated $307 billion, marking it as the second-largest company in the world by this metric.
- Cross-border sales by Shopify merchants exceed $20 billion, underscoring the platform’s effectiveness in facilitating international commerce.
- The success rate of Shopify eCommerce stores is estimated between 5% to 10%, indicating a competitive yet rewarding platform.
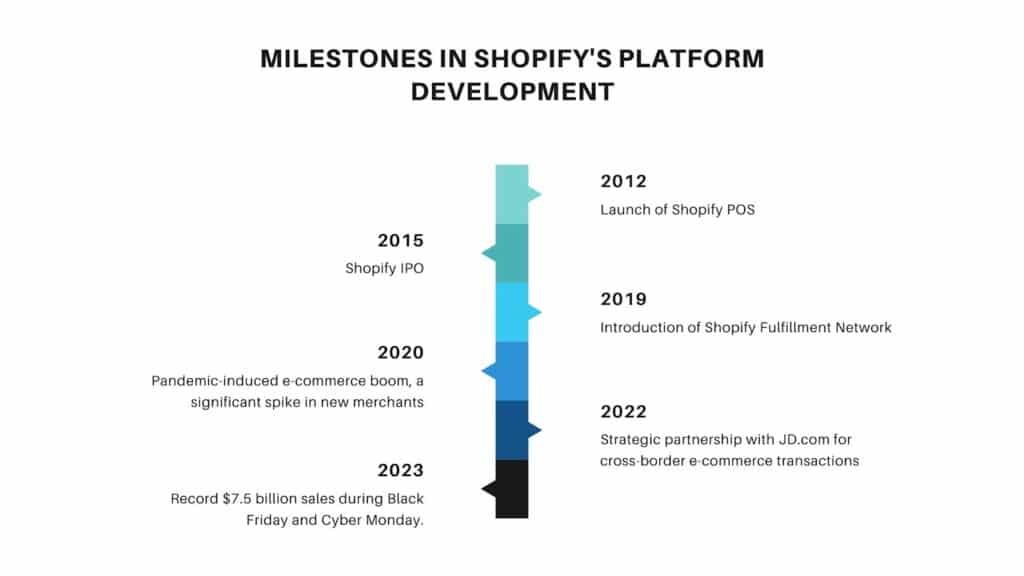
Technological Infrastructure and Engagement
Shopify’s technological infrastructure supports a vast network of over 3.76 million live websites globally.
- 99.3% of Shopify stores utilize Cloudflare, and 95.8% employ the Shopify Fulfillment Network, highlighting Shopify’s robust technological infrastructure and the significant role of mobile optimization, as a substantial portion of Shopify’s traffic and orders originate from mobile devices.
- Shopify’s POS system is used by more than 100,000 merchants, showcasing the platform’s reach in both online and physical retail sectors.
- Shopify’s App Store, with expenditures surpassing $100 million and an average application usage count of six per merchant, contains over 10,000 apps to enhance store functionalities and merchant capabilities.
- Mobile devices account for 79% of traffic and 69% of orders on Shopify, emphasizing the predominant role of mobile commerce in contemporary e-retailing strategies.
The platform’s utilization of advanced web traffic and eCommerce technologies is evident from its dominance among the top-ranking websites by revenue and traffic.
Feature Distribution of Shopify
| Feature | Utilization Rate |
| Cloudflare | 99.3% |
| Shopify Fulfillment Network | 95.8% |
| Mobile Optimization (Traffic) | 79% |
| Mobile Optimization (Orders) | 69% |
Marketing, Partnerships, and Global Presence
Shopify’s marketing efforts and global presence are substantial, with the highest concentration of stores in the US. Instagram and Facebook are the primary social media platforms used for marketing.
| Feature | Utilization Rate |
| 47.2% | |
| 43.5% | |
| Shopify Plus | 32,181 stores |
| Geographic Spread | US, UK, AU, BR, DE |
- Strategic partnership initiated in 2022 between Shopify and JD.com to facilitate cross-border eCommerce transactions for Shopify’s US and international businesses with reduced setup duration.
- Shopify Plus platform showcases a revenue range from $1 million to $500 million annually, indicating the revenue potential for merchants within this tier, with Shopify Plus adoption recorded at 32,181 stores across 175 countries, predominantly in the United States, reflecting the platform’s scalability for larger retail operations.
- Geographic distribution of Shopify stores highlights the United States hosting 2,978,547 stores, leading in volume globally, underlining the platform’s international appeal.
Revenue and Economic Impact
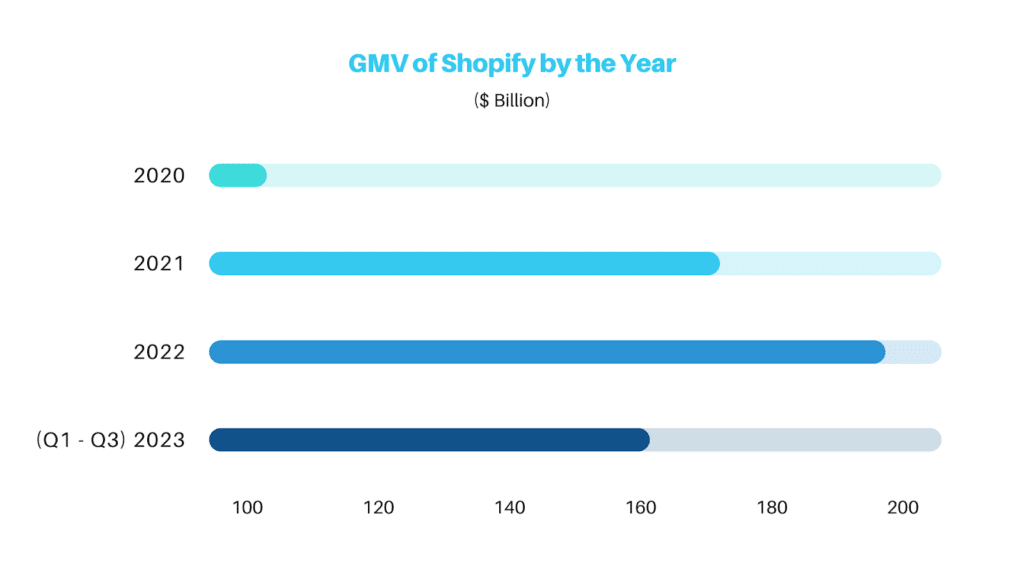
Shopify’s gross merchandise volume reached nearly $50 billion in the first quarter of 2023, illustrating the vast scale of commerce conducted on the platform.
- Shopify stores have an average add-to-cart rate of 4.6%, and email marketing generates the highest conversion rate at 4.29%.
- Shopify’s Merchant Solution revenue in the first three quarters of 2023 was $3.6 billion, highlighting significant revenue from payment processing fees, referral fees, advertising, and POS hardware sales.
- Monthly revenue per Shopify store averages $5,583, culminating in an annual figure of approximately $67,000, delineating the revenue capabilities for merchants on the platform.
Total global sales via the Shopify platform are estimated at $200 billion, highlighting the extensive volume of commerce transacted through Shopify-enabled storefronts.
Digital Storefront and User Engagement
Shopify’s digital storefront presence and user engagement metrics demonstrate substantial growth and broad market engagement.
- Decoupling the front end for flexibility and customization in Shopify stores, including CMS, enterprise applications, and streaming services, is a significant trend in enhancing user experience.
- The platform recorded over 58 million site visits in 2020, illustrating broad market engagement.
- Shopify’s digital storefront presence amounts to 5.6 million as of the year 2023, reflecting substantial growth in merchant adoption.
| Feature | Statistic |
| Site Visits (2020) | 58 million |
| Digital Storefronts | 5.6 million (2023) |
| Daily Active Users | 2.1 million (2023) |
- eCommerce storefront success rates on Shopify oscillate between 5% and 10%, with a noteworthy expansion of 201.53% post the COVID-19 pandemic, indicative of the platform’s resilience and attractiveness.
Daily active users on Shopify surpassed 2.1 million as of 2023, illustrating the platform’s significant daily engagement and utility.
Market Position and Innovation
Shopify’s stature as the third-largest online retailer in the United States after Amazon and eBay delineates its market position and influence within the U.S. retail ecosystem.
The utilization of third-party applications by more than 80% of Shopify retailers, with installations exceeding 25.8 million apps, underscores the extensive integration and customization capabilities available to merchants through the Shopify ecosystem.
- A two-fold higher likelihood of product purchase by online shoppers when presented with a 3D model over a flat image, indicating the importance of enhanced product visualization techniques in improving eCommerce conversion rates.
| Feature | Statistic |
| Market Position (US Retail) | 3rd |
| 3D Model Purchase Likelihood | 2x higher |
Investments in AI, machine learning, and mobile optimization have significantly enhanced the merchant and customer experience, underlining Shopify’s commitment to leveraging technology for eCommerce innovation, including better SEO campaigns, ranging from market research to user experience.
Conclusion
In essence, Shopify’s trends show the growing necessity for scalable and user-friendly eCommerce solutions. Its trajectory reflects not just the evolution of a platform but the changing world of global retail, highlighting the platform’s role in democratizing online sales for businesses worldwide.